SLOs That Actually Work: Error Budgets, Burn Rate Alerts, and Avoiding Alert Fatigue
Most teams define SLOs, celebrate the work, and then never act on them. The problem isn't the SLO itself — it's that the alerting model is wrong and the organizational buy-in is missing. Here's how to fix both.
Every team I've worked with in the past few years has defined SLOs.
If your monitoring tools (like Prometheus or Datadog) are already in place, but your on-call engineers are still exhausted, the problem is likely your alerting model. Maybe only 20% of teams actually use those SLOs to make decisions. The rest have a document somewhere (usually a Confluence page titled "SLO Definitions - v3 - FINAL") that describes availability targets, a Grafana dashboard that nobody opens unless there's an incident, and some threshold alerts that fire constantly at a level that makes the on-call rotation miserable.
This is not what SLOs are for. The whole point is to give your engineering team a quantified budget for taking risk — and to align that budget with what users actually care about. When SLOs work, they change how your team prioritizes reliability work. When they don't, they're just numbers.
This post is about making them work.
SLI, SLO, SLA: The Definitions That Actually Matter
These three acronyms get conflated constantly, even by people who should know better.
SLI (Service Level Indicator) is a measurement. It's a ratio: the number of good events divided by the total number of events, expressed as a percentage over a time window. "99.2% of requests over the last 30 days returned a 2xx status code in under 500ms."
SLO (Service Level Objective) is the target you set for an SLI. "We target 99.5% of requests completing successfully within 500ms over a rolling 30-day window." This is an internal engineering commitment. It's what drives engineering decisions.
SLA (Service Level Agreement) is the contractual commitment to customers. It's always looser than your SLO — typically by 0.5–1%. If your SLO is 99.5%, your SLA might be 99%. The gap between SLO and SLA is a buffer: if you miss your SLO, you want time to fix it before you breach your SLA and trigger penalties or customer escalations.
The critical thing: SLAs are a business document. SLOs are an engineering tool. Don't conflate them. Your SLO needs to be ambitious enough that it's actually challenging to maintain. An SLA that's hard to breach is a different thing.
Choosing the Right SLI
This is where most teams go wrong first. They choose SLIs that are easy to measure rather than SLIs that represent what users actually care about.
The canonical SLI framework from Google's SRE book has four categories:
- Availability: Is the service responding at all?
- Latency: Is it responding fast enough?
- Error rate: Are responses correct?
- Throughput: Can it handle the load?
For most user-facing services, the right SLI is a combination of availability and latency. A request that returns HTTP 500 is a bad event. A request that takes 30 seconds is also a bad event, even if it returns 200.
The request success rate formula:
SLI = (requests that are good) / (total requests)

where "good" means:
  - HTTP status 2xx or 3xx (not 4xx/5xx)
  - Response time < threshold (e.g., 500ms p99)
Avoid SLIs based on infrastructure metrics like CPU usage or memory. These are useful for debugging but they don't directly represent user experience. A service can have 90% CPU and still be serving requests fine. A service can have healthy CPU and be returning 500s on every request.
The 4xx Problem
Be deliberate about whether client errors (4xx) count as bad events for your SLI. My default is: 4xx errors caused by client mistakes (invalid input, auth failures) don't count — they're the client's fault, not a service availability problem. But 404s for resources that should exist, or 429s (rate limiting) hitting legitimate users — those may warrant inclusion.
There's no universal answer. Make the decision deliberately and document it.
Error Budgets: The Part That Changes Engineering Culture
An error budget is the complement of your SLO. If your SLO is 99.5% over 30 days, your error budget is 0.5% — roughly 3.6 hours of downtime, or about 216 minutes.
The error budget isn't just a number. It's a decision-making tool. Here's what it enables:
-
Reliability vs. feature velocity trade-off becomes explicit. When the error budget is healthy, the team can ship fast and take risks. When it's depleted, the team should stop shipping new features and focus on reliability work. This is a conversation grounded in data, not feelings.
-
Blameless post-mortems get a quantitative anchor. "We burned 40% of this month's error budget in the deployment incident" is a concrete statement that helps prioritize the follow-up work.
-
SRE / dev alignment. SREs are often pushing back on deployment frequency ("we need to slow down") while developers push forward ("we need to ship"). The error budget makes this an engineering conversation, not a political one. If budget is available, ship. If it's not, fix reliability first.
The culture change requires leadership buy-in. An error budget policy has to actually stop feature deployments when budget is depleted. If the organization overrides the policy every time it inconveniently says "stop," you get the worst outcome: the overhead of SLOs without the organizational benefit.
Why Threshold Alerts Are the Wrong Model
The conventional alerting model is threshold-based: "Alert if error rate > 1% for 5 minutes." This seems reasonable but creates two failure modes:
Too sensitive: A brief spike that doesn't materially affect users triggers a page. The on-call engineer wakes up, investigates, finds nothing actionable, and goes back to sleep slightly more exhausted. Repeat 3x/week and you get alert fatigue — engineers start ignoring pages, which is when real incidents get missed.
Too insensitive: A slow burn — a 0.5% error rate that persists for 48 hours — never crosses the 1% threshold. But over 48 hours, you've burned through a significant chunk of your monthly error budget. No alert fires. The next threshold alert fire is orthogonal to the actual reliability problem.
The fundamental issue: threshold alerts react to instantaneous rate. Error budgets care about cumulative impact over time. These are different things.
Burn Rate Alerts: The Right Model
Burn rate answers a different question: at the current rate of errors, how fast are we consuming our error budget?
A burn rate of 1 means you're consuming error budget at exactly the rate your SLO allows — you'll use it up precisely at the end of the window. A burn rate of 2 means you'll exhaust it in half the window. A burn rate of 14.4 means you'll exhaust it in 5 hours (14.4 × 2 hours = 28.8 hours... let me be precise here).
For a 30-day window:
- Budget =
(1 - SLO_target) × 30 days × 24 hours × 60 minutes - For 99.5% SLO: budget =
0.005 × 43200 minutes = 216 minutes - Burn rate of 1 = consuming 216 minutes worth of budget over 30 days
The Google SRE workbook recommends a two-tier alert system:
Tier 1 (Page immediately): Burn rate > 14.4 over the last 1 hour AND burn rate > 14.4 over the last 5 minutes. At burn rate 14.4, you exhaust a 30-day budget in ~2 hours. This is a real incident.
Tier 2 (Ticket within hours): Burn rate > 6 over the last 6 hours AND burn rate > 6 over the last 30 minutes. At burn rate 6, you exhaust a 30-day budget in ~5 days. This needs attention but isn't an immediate page.
The dual-window check (1hr + 5min, 6hr + 30min) prevents false positives from brief spikes. A spike that lasts 5 minutes doesn't trigger the 1-hour window. A slow sustained burn triggers both.
Prometheus Recording Rules for SLOs
Calculating burn rate in real-time from raw metrics is expensive. Prometheus recording rules pre-compute the values you need at regular intervals.
First, define your SLI recording rule:
1# prometheus-rules.yaml
2groups:
3- name: slo_rules
4  interval: 30s
5  rules:
6  # SLI: ratio of good requests
7  - record: job:request_success_rate:ratio_rate5m
8    expr: |
9      sum(rate(http_requests_total{status=~"2..|3.."}[5m])) by (job)
10      /
11      sum(rate(http_requests_total[5m])) by (job)
12
13  - record: job:request_success_rate:ratio_rate30m
14    expr: |
15      sum(rate(http_requests_total{status=~"2..|3.."}[30m])) by (job)
16      /
17      sum(rate(http_requests_total[30m])) by (job)
18
19  - record: job:request_success_rate:ratio_rate1h
20    expr: |
21      sum(rate(http_requests_total{status=~"2..|3.."}[1h])) by (job)
22      /
23      sum(rate(http_requests_total[1h])) by (job)
24
25  - record: job:request_success_rate:ratio_rate6h
26    expr: |
27      sum(rate(http_requests_total{status=~"2..|3.."}[6h])) by (job)
28      /
29      sum(rate(http_requests_total[6h])) by (job)
Then define error budget burn rate alerts:
1- name: slo_alerts
2  rules:
3  # Tier 1: Fast burn — page immediately
4  # Burn rate > 14.4 means budget exhausted in ~2 hours
5  - alert: ErrorBudgetFastBurn
6    expr: |
7      (
8        job:request_success_rate:ratio_rate1h{job="payment-service"} < (1 - 14.4 * (1 - 0.995))
9      )
10      and
11      (
12        job:request_success_rate:ratio_rate5m{job="payment-service"} < (1 - 14.4 * (1 - 0.995))
13      )
14    for: 2m
15    labels:
16      severity: critical
17      team: payments
18    annotations:
19      summary: "Fast error budget burn on {{ $labels.job }}"
20      description: >
21        {{ $labels.job }} is burning its error budget at >14.4x the normal rate.
22        At this rate the monthly budget will be exhausted in approximately 2 hours.
23        Current 1h success rate: {{ $value | humanizePercentage }}
24
25  # Tier 2: Slow burn — create a ticket
26  - alert: ErrorBudgetSlowBurn
27    expr: |
28      (
29        job:request_success_rate:ratio_rate6h{job="payment-service"} < (1 - 6 * (1 - 0.995))
30      )
31      and
32      (
33        job:request_success_rate:ratio_rate30m{job="payment-service"} < (1 - 6 * (1 - 0.995))
34      )
35    for: 15m
36    labels:
37      severity: warning
38      team: payments
39    annotations:
40      summary: "Slow error budget burn on {{ $labels.job }}"
41      description: >
42        {{ $labels.job }} is burning its error budget at >6x the normal rate.
43        At this rate the monthly budget will be exhausted in approximately 5 days.
The 1 - 14.4 * (1 - 0.995) formula: for a 99.5% SLO, 1 - SLO = 0.005. Multiplying by 14.4 gives 0.072. Subtracting from 1 gives 0.928. So the alert fires when success rate drops below 92.8% in the measurement window — which corresponds to consuming budget 14.4x faster than expected.
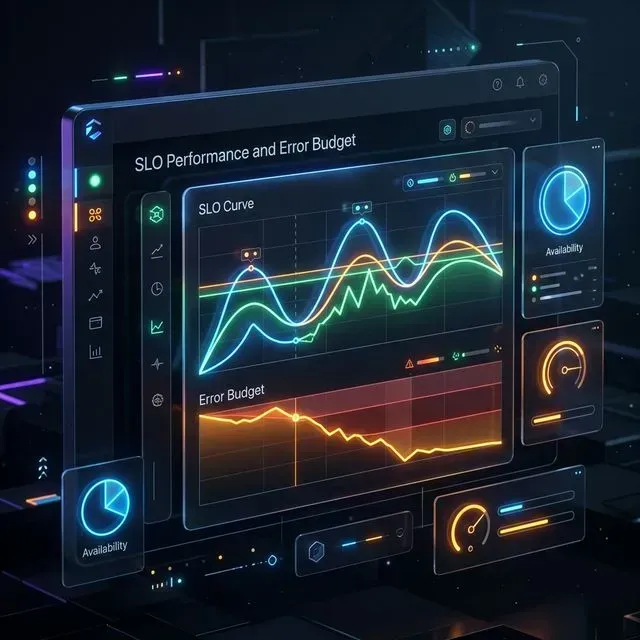
Error Budget Tracking Dashboard
Beyond alerts, you need a dashboard that shows error budget consumption over the rolling 30-day window. This is what the team looks at in weekly reliability reviews.
1# Recording rule for remaining error budget percentage
2# Formula: 1 - (actual_error_rate / allowed_error_rate)
3# = 1 - ((1 - avg_success_rate) / (1 - SLO_target))
4- record: job:error_budget_remaining:ratio
5  expr: |
6    1 - (
7      (
8        1 - (
9          sum_over_time(job:request_success_rate:ratio_rate5m{job="payment-service"}[30d:5m])
10          /
11          count_over_time(job:request_success_rate:ratio_rate5m{job="payment-service"}[30d:5m])
12        )
13      )
14      /
15      (1 - 0.995)
16    )
When this metric reads 0.75, you have 75% of your error budget remaining for the 30-day window. When it reads 0, you're exactly at your SLO target. When it reads negative, you've breached your SLO.
To verify the math: if your service had a 99.7% success rate over 30 days, actual error rate = 0.003, allowed error rate = 0.005, so budget remaining = 1 - (0.003 / 0.005) = 0.4 — 40% remaining.
Introducing SLOs Without Creating Alert Fatigue
The practical advice I give teams when starting from scratch:
Start with one service, one SLI. Pick your most important user-facing service. Define a single request success rate SLI. Don't try to instrument everything at once. Get one SLO working end-to-end — recording rules, alerts, dashboard, error budget policy — before expanding.
Set the initial target based on historical data. Pull your actual error rate for the past 90 days. Set the SLO target at your P75 historical performance (not your best day, not your aspiration). This gives you an achievable baseline to start from. Tighten it as reliability improves.
Silence alerts in staging. Burn rate alerts on staging environments create noise and train engineers to ignore SLO alerts. Keep SLO alerting for production only.
Hold a monthly error budget review. Spend 30 minutes looking at budget consumption trends. Which services are chronic budget burners? Which services have so much budget that the SLO is too loose? This is where the SLO actually drives engineering decisions.
Don't add more SLOs until the first one is actionable. If your team isn't acting on budget alerts or can't articulate what actions the current SLOs drive, adding more SLOs just adds more ignored metrics.
The Reliability Conversation SLOs Enable
Here's what well-functioning SLOs change in practice:
Instead of "should we do a code freeze before the holiday season?", the conversation becomes "we have 40% error budget remaining, at current velocity we'll have 15% left by Christmas, and here's what we'd need to ship to maintain that buffer."
Instead of "why is the SRE team always blocking our releases?", the conversation becomes "we're at 8% budget remaining with 3 weeks left in the window, here's the policy we agreed to."
Instead of "the alert fired again, false positive, acknowledge and move on", the conversation becomes "that was a burn rate of 8x for 4 hours, we consumed 15% of our monthly budget in an afternoon, here's the post-mortem."
SLOs don't solve organizational alignment by themselves. But they give the reliability conversation a numerical foundation that's much harder to dismiss than feelings and opinions.
Frequently Asked Questions
What is the most common mistake when first setting SLOs?
Setting your SLO targets too high (e.g., 99.99%) without understanding your historical baseline. This leads to constant budget depletion and alert fatigue. Start with a target slightly better than your current P75 performance and tighten it as reliability improves.
How do I handle scheduled maintenance in my SLOs?
Most teams use "windows of exclusion" in their SLI calculation for scheduled maintenance. However, some argue that if a maintenance window affects users, it should count against the budget. The best practice is to be consistent: if you exclude it, document it clearly.
Should I define SLOs for my CI/CD pipeline?
Absolutely. Slow and flaky CI/CD pipelines are a major hidden killer of developer velocity. Defining an SLI for "time to commit to production" and setting an SLO for it (e.g., 80% under 20 minutes) can help justify investment in build optimization.
What is the difference between a "slow burn" and a "fast burn" alert?
A fast burn alert detects a massive, immediate outage (e.g., you're burning your monthly budget in 2 hours) and should page someone immediately. A slow burn alert detects a subtle, persistent issue (e.g., you'll exhaust your budget in 5 days) and should create a non-urgent ticket for review during business hours.
Want help designing SLOs and error budget policies for your Kubernetes services? Talk to us at Coding Protocols. We help platform teams build reliability practices that engineering leadership and product teams can both trust and act on.